005 #summer
We are at summer solstice (or 夏至, summer's extreme), the start of summer, a time of positive energy and renewal. How are you greeting the season? Following the Open Research Data experience, we are making plans: about a week from now, meeting up at the Opendata.ch/2015 conference on July 1st. Soon after that, participating in the Festival of Code, one the world's largest youth coding events, on July 27-31. Some of us hope to take part in an upcoming Muséomix: apply until June 30 to team up in November. Meanwhile we are continuing work on documenting/ formalising the concept of SoDa. Are we headed in the right direction, or does it sound like music of celestial spheres? Jump in and share a piece of mind.

^- Orbite de la terre autour du soleil, via British Library (Public Domain)
Festival of Code
Our friends at FabLab Bern have invited us to set up camp at their awesome techno-chalet in central Berne during the Festival of Code week that we've been planning. Join us if you would like to start data projects with kids around the world - and if know kids that are keen to code, invite them too!
There are lots of great initiatives in Switzerland to encourage kids to code: Bug'n'play, CoderDojo, Rails Girls, and so on. But this Festival is not just about programming, there are many ways to make fun things out of data, even though kids and adults who have some experience should find themselves a little more "at home". Please sign up at soda.camp/festival to take part.

^- laser cutting the Google Cardboard VR in a 3D coding meetup at the Fab Lab
Muséomix
This is an innovative event series that started in France and has really taken off in other European countries, including a first Swiss appearance on the Lake of Geneva last fall. This November it will take place in Berne, and we are helping them spread the word, collect data and materials, and encourage everyone reading this (yes - YOU!) to apply to participate this fall. The deadline for signing up is only days away (June 30) so hurry up and get your name in!
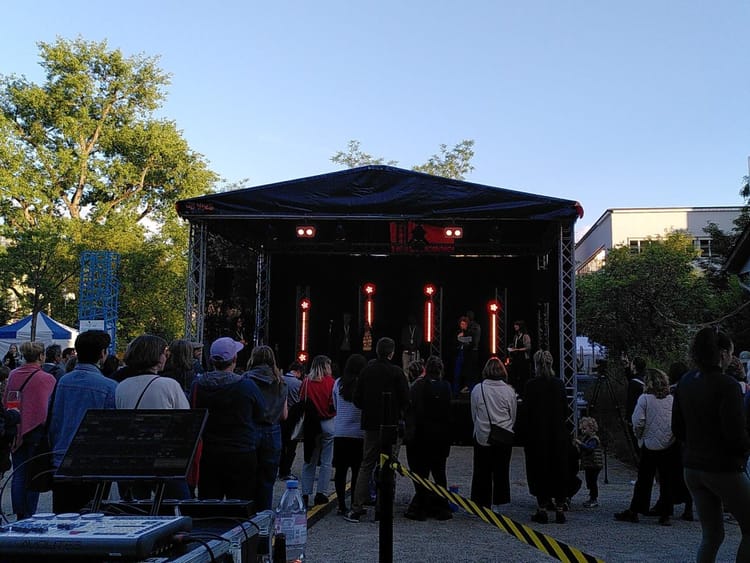
The idea is catchy: bring tools of digital reproduction and creation to a museum and get to work "remixing" art, in a similar way to how musicians sample each other's productions, adding their own tracks and shuffling things around. It's an exciting, eye opening new way to experience culture, and while open for public visits, it is also a hackathon: participants are mixed into random teams of 6, and work together all weekend at the museum. You can see what goes on at museomix.ch
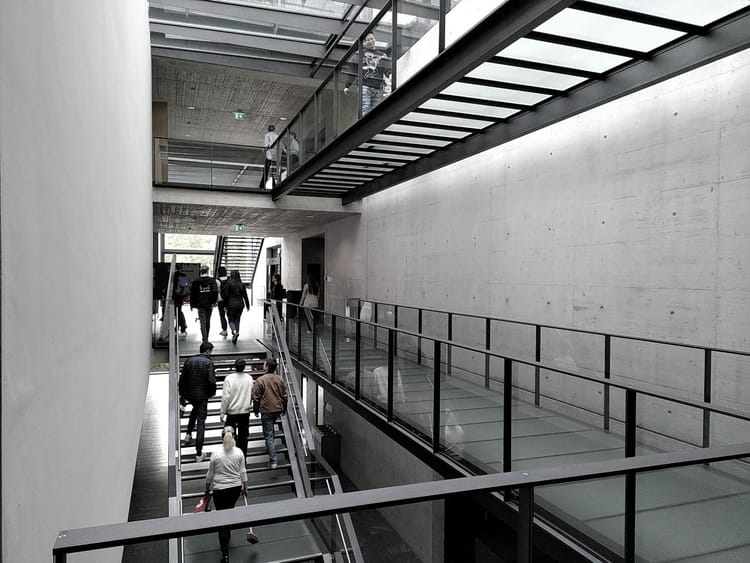
Looking forward to what's going to be an amazing event at one of the most dataful institutions of Berne: the Museum of Communications!
^- Last year's event at the Museum of History and Art in Geneva
Drawing Data
Before you continue with your long summer day or night, do indulge for a minute in this neat interactive graph in a recent New York Times that draws data from its users before it lets you see the real thing. It's almost like you pay for better knowledge with a little test of your own. This reminds me of a project a couple of years ago mapping concensus of neighborhood boundaries in Boston. Instead of thinking of data as something "out there", we are realising through projects like these that data (geographic, social, etc.) gains an intrinsic, indefinable quality - making it all the more interesting. What are your thoughts? Perhaps you should join our colloquy and share them. Until then - enjoy your summer!

You Draw It: How Family Income Affects Children's College Chances (New York Times, 28.5.) is 'assumption-challenging journalism'. Readers draw guesses first, get real answers after -@lucyfedia


 The works on this blog are licensed under a Creative Commons Attribution 4.0 International License