013 #energy
[TL;DR] The Open Energy Data Hackdays that took place on April 8+9, 2016 resulted in 8 new energy projects. This blog talks about a pre-hackdays workshop in Bern where we discussed topics and platforms, and shares some background and outlook on open energy data.
Energy is on our minds as the sun peeks out from behind the winter clouds - and it is a topic as big as they get. To kick brain cells into action, we started a thread here at soda.camp and invited a couple of new and old friends to a chat to talk about energy data, platforms and things-to-hack.
Before running open data hackdays in Switzerland, at one point I (@loleg) took part in a hackathon with Pachube (an early Internet of Things platform), connecting Arduinos to current meteres and making visualisations of energy consumption. Another time there was a special guest at OxHack introducing us to Open Energy Monitor and their platform emoncms:

Thanks to Ken Boak the current maintainers of the project joined us for a vidcall: we talked to Glyn Hudson and Trystan Lea, as well as with Damon Hart-Davis from the OpenTRV project. In Bern with us was Olaf Zanger from the Energy Working Group (..more about that later), and Markus and Hannes from the Zebbra.ch team who kindly hosted our meetup. We brainstormed ideas and planned how we could work together at the upcoming hackdays (on-location and virtually).
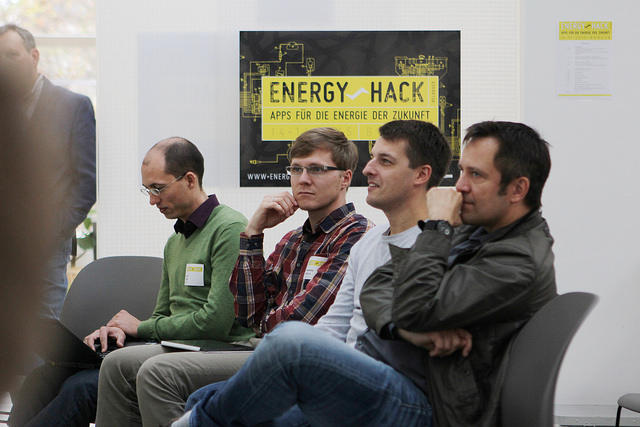
We first looked at the open data - I gave a quick tour of our energy data wiki, mentioned startup initiatives to make use of relevant real-time environmental and other data, and efforts to open more government data in Switzerland. We took a peek at energy-themed Open Knowledge community events in Germany (photo below) and Finland.
We thought about suggesting these four possible "subthemes" within which it could make sense to pitch projects at the hackdays:
- Energy of Production. Electricity and other power sources ...
- Energy of Distribution. Efficient storage and transmission ...
- Energy of Transport. The ways we move people and goods ...
- Energy of Buildings. Hardware, sensors, climate controls ...
Then it was demo time! Our guests from Open Energy Monitor showed us their current project involving data from ~100 houses in the UK, where smart devices like electric cars being timed to charge at peak periods of solar power productivity

You can follow their work on developing an Open source virtual smart grid renewable energy aggregation and sharing concept with a focus on carbon metrics on GitHub.
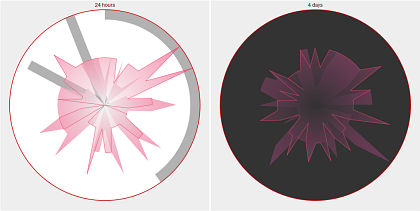
Damon talked more about the algorithmic side of things, on making smart guesses and estimating the power outputs of entire nations in his studies of the European energy market. By modelling "grid carbon intensity" he is able to create models like this one:

I'm afraid my limited knowledge of the domain hindered me from understanding the full implications of this work but you should definitely check out OpenTRV and Saving the Planet @Home for their disruptive initiatives to change energy habits in the UK.
Many thanks for your time & provocative ideas Glyn, Trystan and Damon!
Rocking with Open Energy
It now becomes blithingly clear that "energy data" is a super broad topic, which makes it difficult to know where to start. Even the big ones get it wrong sometimes..
Using latest data from BP, wind provided 3.05% of our electricity in '12, showing they confused energy with electricity. @TheAusInstitute
— Ben McCombe (@BenMcCombe) December 8, 2014
At the same time, everyone should at least be able to find some interest area 'close to home'. We all expend energy in our daily lives. We are all at least mildly aware of some of the issues surrounding energy use on the national and planetary scale. There is so much more to learn and, if we even just influence our own and our neighbors' behavior - there are many critical paths at stake.
In Switzerland, the energy data discussions began at the beginning of the young history of the open data community. At the first Swiss open data hackathon, the project Green Street was an example of several mashups that tackle the question of what can be done when measures of energy consumption or production are combined with open geodata and other information sources. Meanwhile, as it is the case around Europe, in Switzerland electricity is one of the hottest topics in politics...
Press review: How to keep the Swiss electricity market afloat https://t.co/AnCsfzP6Ke pic.twitter.com/KmHzC6Tx4j
— swissinfo.ch (@swissinfo_en) March 13, 2016
 Last year, on the same day as we formed our School of Data Working Group, Opendata.ch also formed an Energy Working Group and a small engaged community starting exchanging notes on the subject. The goal is to open up data about the production, transmission and usage of energy in Switzerland — and to make it used and useful.
The open data community has recently seen a slate of interesting projects come out of energy data releases on both the national and regional Open Government Data portals. The upcoming Swiss Open Energy Data Hackdays will be a chance for our community to plug into all the previously released datasets as well as emerging sources, come up with concepts and create demos that prove that transparency in things like energy monitoring and is not a pipe dream, but part of the next wave of innovation in accountable business practices, transparent energy policy, and sustainable, rational, progressive energy reform.
As usual, there will be lots of data. There will be WiFi and food. A bunch of smart, enthusiastic, creative and conscientious people. The hackathon will take place at a couple of the coolest locations (literally and metaphorically) we have yet to experience: near the largest wind farm in Switzerland (~60 MkWh) at Juvent in Mont Croisin; and under a huge alpine hydroelectric dam with 9 generators (>1000 MW) at Grimsel.
 Source: Juvent.ch
 Source: Grimselstrom.ch
Post Scriptum
Humour me for a kilowattsecond. What do data and energy have to do with each other? Let's see. In physics, we would say that:
- energy is the ability to do work, the capacity to cause things to happen
- energy is always "conserved" — it can be transferred between objects or systems by the interactions of forces
- energy comes in multiple forms, and can be converted from one form to another (e.g. kinetic and potential energy)
- E = mc2
In technology:
- information is the ability to answer questions, the capacity to derive data and knowledge
- information is transferred as the content of a message or through direct or indirect observation of some thing
- information comes in multiple forms, such as when it is represented or coded as data
- infergy = medium * data ^ interfaces
I use the term infergy here to posit a measure of Inference, of the causal effects of information - like the potential to cause a decision to be made. Where the medium can be a container like a piece of paper, or the code of a web site. Interfaces are all the possible networks and channels through which information can be accessed.
Energy is to Matter as Data is to Code
Think I'm completely off my rocker? Maybe. But if our mission here at the nascent Swiss School of Data is to spread data literacy, we should be willing to come up with all kinds of mental crutches to help break barriers between areas of knowledge. Read up on Information theory or Digital physics, and let me know. Then come raise the infergy levels with us as we hack energy open data!




 The works on this blog are licensed under a Creative Commons Attribution 4.0 International License